Inspired by the idea of wins above replacement in baseball and real plus-minus in basketball, I created a metric that measures the contribution of each player, position group and side of the ball for every snap in an NFL season. I call it WIN SHARE to reflect the fact that 11 players are working together on the field for each team at any given time, meaning that the “share” part is a really big factor — and the interconnectedness took a lot of time to model out.
The metric is built around the number of times a player impacts first downs and touchdowns that lead to wins or losses, either by creating first downs and touchdowns on offense or by preventing them on defense. On-ball impact (like when a wide receiver is targeted directly) and off-ball impact (like when a wide receiver draws coverage away from other players on the field, resulting in a better matchup for someone else) are both measured. Win share adds up all of the positive on- and off-ball plays and subtracts the negative ones in order to help attribute a value to each player and phase of the game, as represented by the number of wins each player is responsible for on an individual level in a given season. Personnel on the field, game situations and matchups are all factored in, to the degree that it’s possible.
Now the important part: Who will pace the NFL in win share in 2023? Below, you’ll find the top five projected leaders among quarterbacks, non-quarterback offensive players and defensive players, listed with their predicted win shares for the 2023 campaign. And you might be surprised by some of the rankings — I know I was.
Let me know what you think! You can reach me on X at @cfrelund and IG @cynthiafrelund.
Related Links
- Top nine NFL offenses in 2023: AFC well represented in rankings, but surprise NFC team earns No. 1 spot
- 2023 fantasy season: Hype train or smokescreen? Making sense of NFL preseason news
- 2023 NFL fantasy football breakouts? Five sleepers to target in the later rounds of your draft
- 2023 NFL season: Best/worst-case projections for notable offensive rookies
- 2023 NFL season: Best/worst-case projections for notable defensive rookies
- Chris Jones headlines top 5 defensive tackles; plus, a WR trend and the Aaron Rodgers-Zach Wilson bond
QUARTERBACKS
WIN SHARE: 6.61
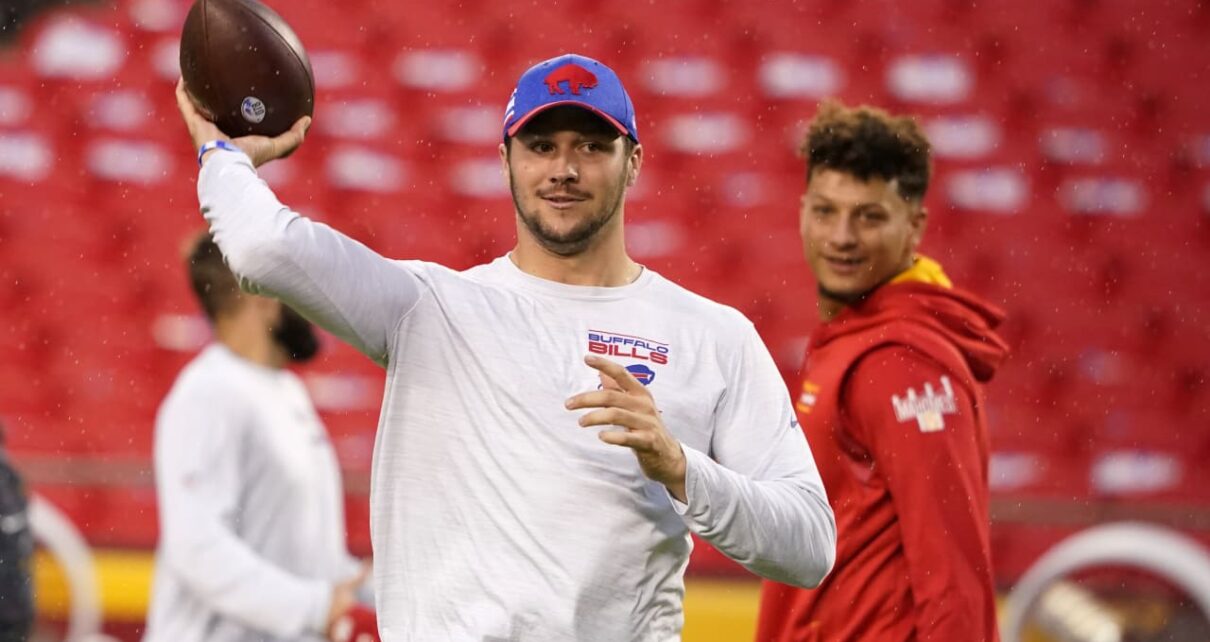
I will never stop being impressed with Allen’s ability to throw strong passes (as measured by velocity using computer vision) in a variety of situations, such as operating off-platform or on the run. The Bills quarterback hurled three of the five highest-velocity throws last season, including one pass that resulted in a 98-yard touchdown. Additionally, of his 124 rushes (which, by the way, produced 762 yards, a healthy 6.1-yard average), 55 resulted in first downs and seven in touchdowns.
That was last year, though, and this article is forward-looking. This offseason, Buffalo bolstered the offensive line — specifically at guard, with free-agent signee Connor McGovern joining the party on the left and second-round pick O’Cyrus Torrence coming aboard on the right. The Bills also changed the strategy at running back, and they added a dynamic tight end (first-rounder Dalton Kincaid) who will create a ton of new options for the team that ran the least amount of 12 personnel in the league last season. Maybe those who pegged Allen for the MVP award last season were a year too early.
WIN SHARE: 6.57
The reigning regular-season MVP and Super Bowl MVP has been the most accurate off-platform thrower (i.e., when his feet aren’t ideally set, as measured by computer vision) each and every season since 2018 by at least 8.5 percentage points. If I isolate QBs and their respective top pass catchers on off-platform throws over the past three seasons, Mahomes and Travis Kelce’s connection not only blows away all others in terms of volume but also is at least 11 percentage points ahead of any other duo. The only reason Mahomes ranks below Allen on this list is because the Chiefs’ path and the AFC West are a bit easier than the Bills’ journey and the AFC East.
WIN SHARE: 6.47
Potential proof that Burrow is indeed a robot: The effectiveness of his throws on downs after he’s been under pressure (taking a sack, a hit or having a player enter his three-foot halo). On average last season, NFL quarterbacks saw a dip in passer rating of 22.3 percent on the very next throw after a pressure. For Burrow, though, the dip was just 1.8 percent. While Zac Taylor deserves credit for savvy play-calling after pressures, that’s an absurd figure. For context, the other four guys on this list averaged a passer rating decrease of 8.4 percent on such plays in 2022.
Last season, Burrow set a new career high with 35 touchdown passes. This season, my models project a median of 37 scoring strikes, with 40 as the top-end mark. I wanted to point that out, because Burrow could easily lead the league in passing touchdowns.
WIN SHARE: 6.35
I’ve been trying to mathematically show how much certain QBs help their offensive lines for quite some time, but this could be the year when I really get the formula down. The O-line is one of the biggest areas of concern for this talented Jets squad. Can the unit hold up long enough on a snap-by-snap basis to allow Rodgers to do his thing? How long does Rodgers typically need to spin magic? In an attempt to answer that latter question, I crunched the numbers on Rodgers’ past three seasons in Green Bay, isolating every snap where the to-go distance was 5 or fewer yards and the Packers passed the football. In that scenario, Rodgers only needed an average of about 1.3 seconds in order to earn a first down or touchdown. Last season, the league-wide average among all NFL quarterbacks was 1.7 seconds (remember, they had to earn the first down or TD). I get that 0.4 seconds seems tiny at first blush, but that’s an average over a ton of attempts. This helps illustrate that Rodgers, given his rare processing ability, only needs his offensive line to be passable for him to succeed.
WIN SHARE: 6.29
My models really like the pairing of Jackson with new offensive coordinator Todd Monken. My models also like the catch-and-run potential of the pass catchers on Baltimore’s offense. That said, my models do have some questions about the Ravens’ defense, which means controlling the game on the offensive side of the ball becomes even more crucial in the very difficult AFC North. The volatility in Baltimore’s outcomes is higher than any other team in 2023 — the season could go really well or it could be tough sledding. My models like the risk, though. And Baltimore was an extremely volatile projection for my models back in 2019, when Jackson went on to become just the second unanimous MVP in league history.
ADDITIONAL QB NOTES:
- Only one NFC quarterback made the top 10 on my expanded list: Philadelphia’s Jalen Hurts, who came an at No. 7.
- Jacksonville’s rising star, Trevor Lawrence, ranked 10th.
NON-QUARTERBACKS
WIN SHARE: 2.34
When it comes to Jefferson, there’s no shortage of awesome stats and metrics to underscore his immense value. Working on this piece, I played around and sorted my pass-catching data to look at contested catches, tight-window catches and separation created on routes. I weighted them equally for the sake of this analysis, as I was trying to identify specific traits receivers possess that significantly help out their quarterbacks. Add it all together, and yes, JJ is predictably No. 1. Not too surprising for the guy who just led the league in receptions (128) and receiving yards (1,809). And entering his second season with Kevin O’Connell calling the plays, Jefferson figures to be even more potent.
WIN SHARE: 2.31
In his first five pro seasons, Chubb has never averaged fewer than 5.0 yards per carry. That conventional stat pops off the page. Using computer vision, I can drill down a bit more on what makes him so special. Over the past three seasons, Chubb boasts top-three rates in ability to avoid contact and ability to keep his center of gravity in a favorable place through the balance of the run. With Kareem Hunt’s departure this offseason, the 27-year-old should get more of the workload. Running behind a stout offensive line, Chubb could enjoy his best season yet.
WIN SHARE: 2.30
Fresh off his seventh straight 1,000-yard season, Kelce is putting together an all-time résumé at the tight end position. My favorite stat from last season? Kelce’s burst in the fourth quarter (speed reached in first 3 yards traveled) decreased at the fifth-lowest rate of any offensive player. That’s a measure of fatigue — or lack thereof — which basically tells you that Kelce is NOT slowing down at age 33.
WIN SHARE: 2.28
Since I started tracking win share, Henry’s off-ball numbers have consistently rated off the charts. In other words, the attention he demands from opposing defenses makes every other Titan’s life much easier. Not to mention, he’s eclipsed 1,500 yards rushing in three of the past four seasons while posting double-digit ground scores in each of the past five. And last season, he set career highs in receptions (33) and receiving yards (398). Per Next Gen Stats, his 192 receiving yards over expected was second among all running backs, behind only Christian McCaffrey.
WIN SHARE: 2.25
As a native Michigander and Lions fan, I know Amon-Ra’s a stud, but I’m not going to lie: This ranking was a pleasant surprise! According to computer vision, St. Brown ranked third among all receivers last season when it came to gaining separation out of the slot (where he primarily lined up).
Admittedly, this ranking is partially driven by the absence of Jameson Williams over the first six games, which will increase Detroit’s reliance on St. Brown. That said, he also carries a bunch of off-ball value, especially on Detroit team that is likely to routinely target a pair of rookies in the passing game (RB Jahmyr Gibbs and TE Sam LaPorta).
ADDITIONAL NON-QB NOTES:
- Davante Adams comes in at No. 6, less than 0.01 behind Amon-Ra St. Brown. Part of the reason Adams just missed the cut: My models really like his new running mate in Las Vegas, Jakobi Meyers.
- Christian McCaffrey trails Davante Adams by 0.1.
DEFENSE
WIN SHARE: 2.39
Football coaches often talk about a player’s cylinder — basically, his torso — typically using the term to refer to how squarely an offensive lineman can put his body in the path of a defender to slow him down. It makes sense that if a defender has a clear path to the QB, it results in a harder hit or at least more effective pressure. One reason why Bosa tops this list: No one produced effective pressure on opposing QBs at a higher rate last season than the 49ers star when a lineman actually had a square angle on him during a play. In other words, according to computer vision, Bosa was slowed down the least when blockers were in position to do their job.
WIN SHARE: 2.388
Yup, Garrett fell just short of Nick Bosa. (I needed to add another digit to the win share in order to display the tiny gap.) Over the past three seasons combined, the Browns star actually ranks No. 1 in the “cylinder”-based metric I just described in the Bosa blurb — creating effective pressure on opposing QBs despite blockers having a square angle on you as a pass rusher. And Garrett was double- or triple-teamed over this time period at the third-highest rate in the league, meaning he wasn’t just facing one cylinder, but multiple. Basically, the man is a force of nature.
WIN SHARE: 2.38
I define burst as the speed a player reaches in the first 3 yards traveled. According to computer vision, Parsons has the fastest burst on a per-rush basis over the past two seasons. It helps that he gets a bit more space to work with than many of his peers, based on where he typically lines up, but Parsons also has a top-10 win rate when blockers are squared up on him.
WIN SHARE: 2.29
My models believe the 2021 Defensive Player of the Year will return to form after an injury-abbreviated 2022 campaign, partially because he’s just such a balanced defender when it comes to all of the metrics that are linked to edge-rushing success. Despite totaling just 5.5 sacks over 10 games last season, Watt still ranked top five in burst, contact win rate and fatigue. He’s a relentless QB hunter who just ticks off all the boxes.
WIN SHARE: 2.20
According to PFF, Gardner allowed just 45.9 percent of passes to be caught in his coverage. That, my friends, is how you win Defensive Rookie of the Year. Furthermore, according to computer vision, Sauce moved his hips into alignment to stop the pass and maintain his closing speed at the best rate of any cornerback last season. The CB combo of Gardner and D.J. Reed is in strong contention to be considered the NFL’s best.
ADDITIONAL DEFENDER NOTES:
- I know everyone’s wondering about a certain defender who will undoubtedly make the Hall of Fame on his first ballot. Well, Aaron Donald ranked No. 6.
- Jalen Ramsey’s injury dropped him off the list. Prior to the meniscus tear, he actually had a higher win share than Sauce Gardner (partially due to the Jets projecting to have a better overall defense than the Dolphins).
Source: Read Full Article


